
Sustainability Report Design That Turns Data Into a Case
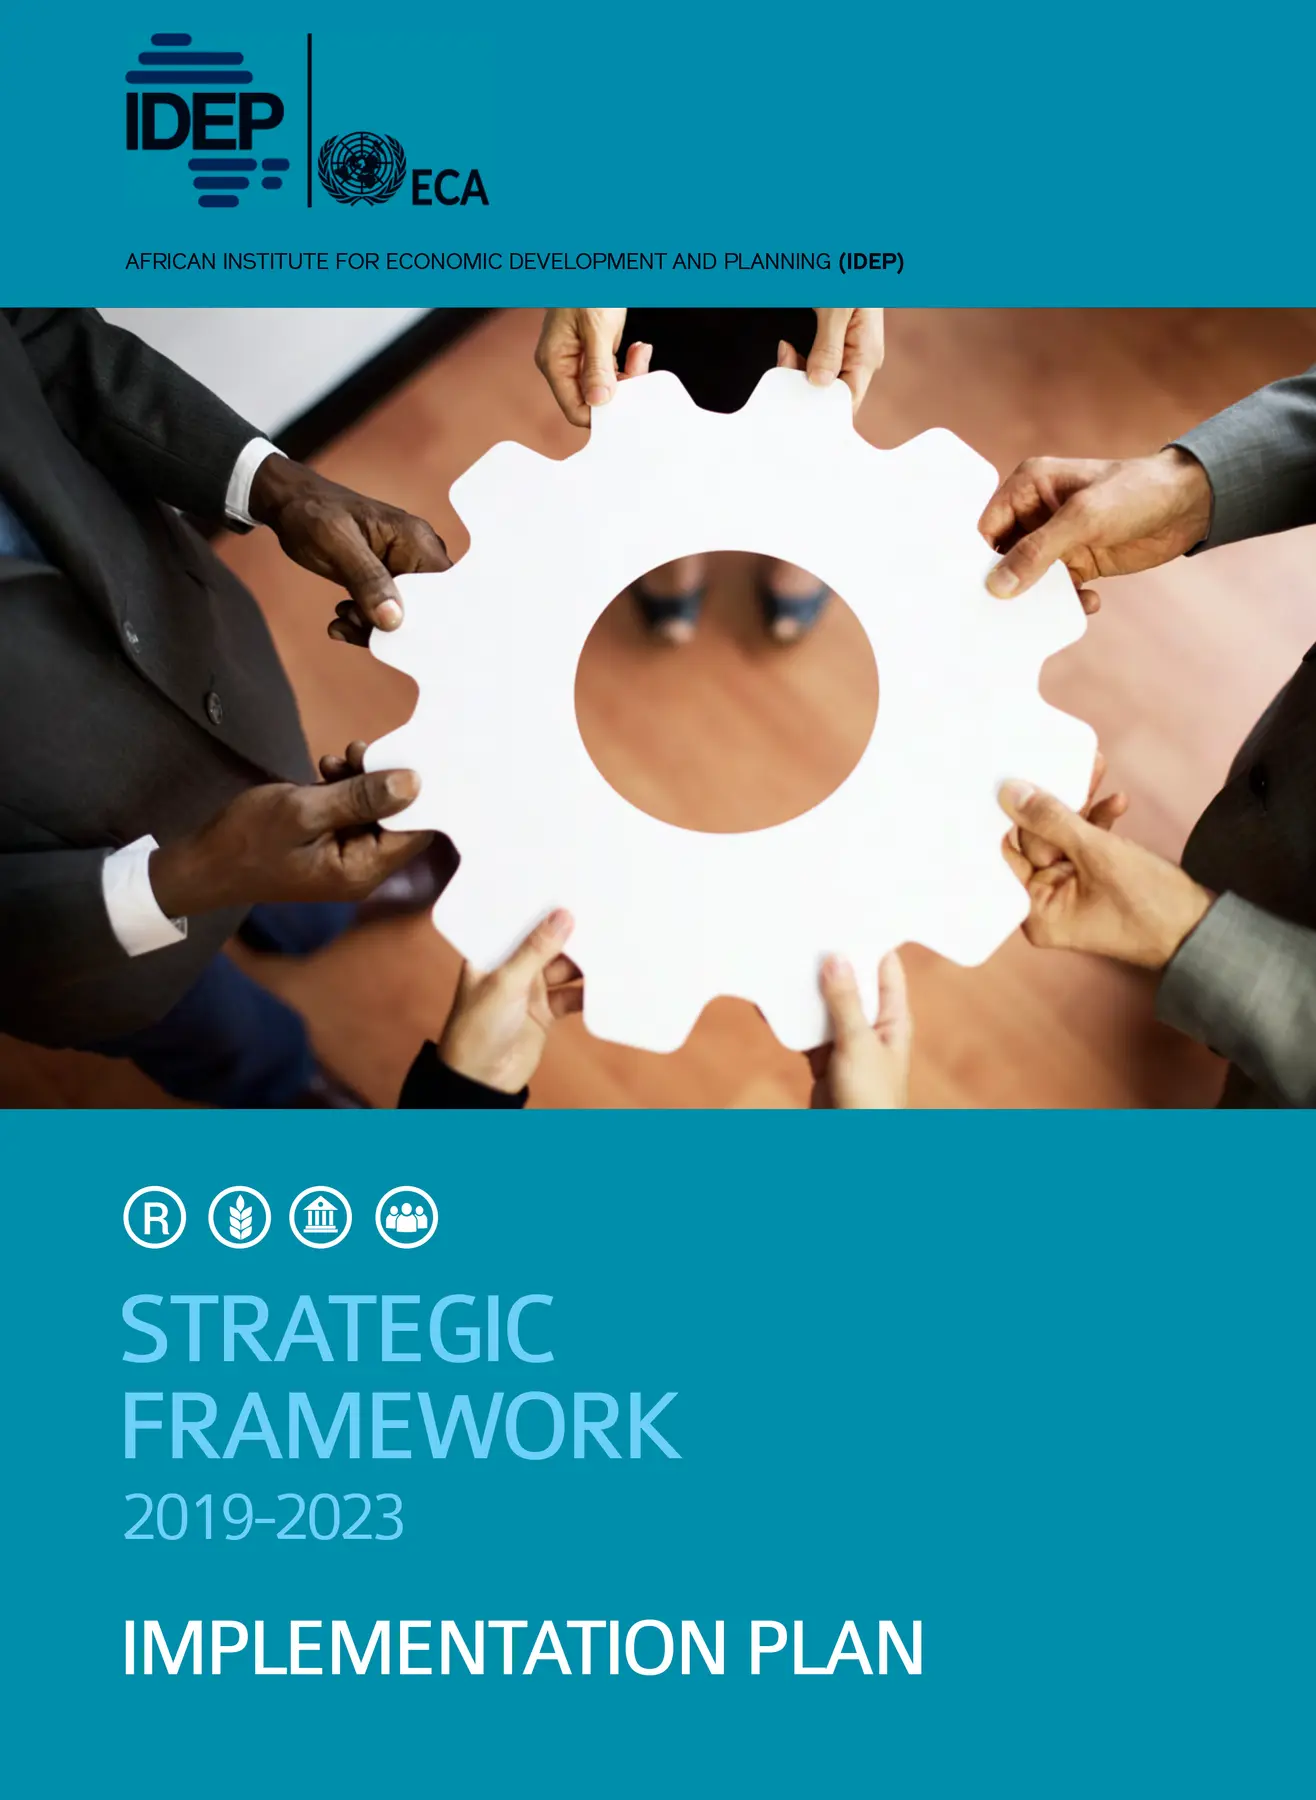
Sustainability report design carries a burden its ESG sibling does not: it must persuade readers who are actively skeptical. Greenwashing fatigue means every unsupported adjective costs credibility. The design answer is evidence-forward structure - data before narrative, targets beside trajectories, SDG mapping that shows work rather than logos. Indak Digital designs sustainability reports as a case being made to a doubtful reader, which is exactly what they are.
At a Glance
Delhi-based design studio; portfolio spans 120+ page report systems (stat from indakdigital.com homepage)
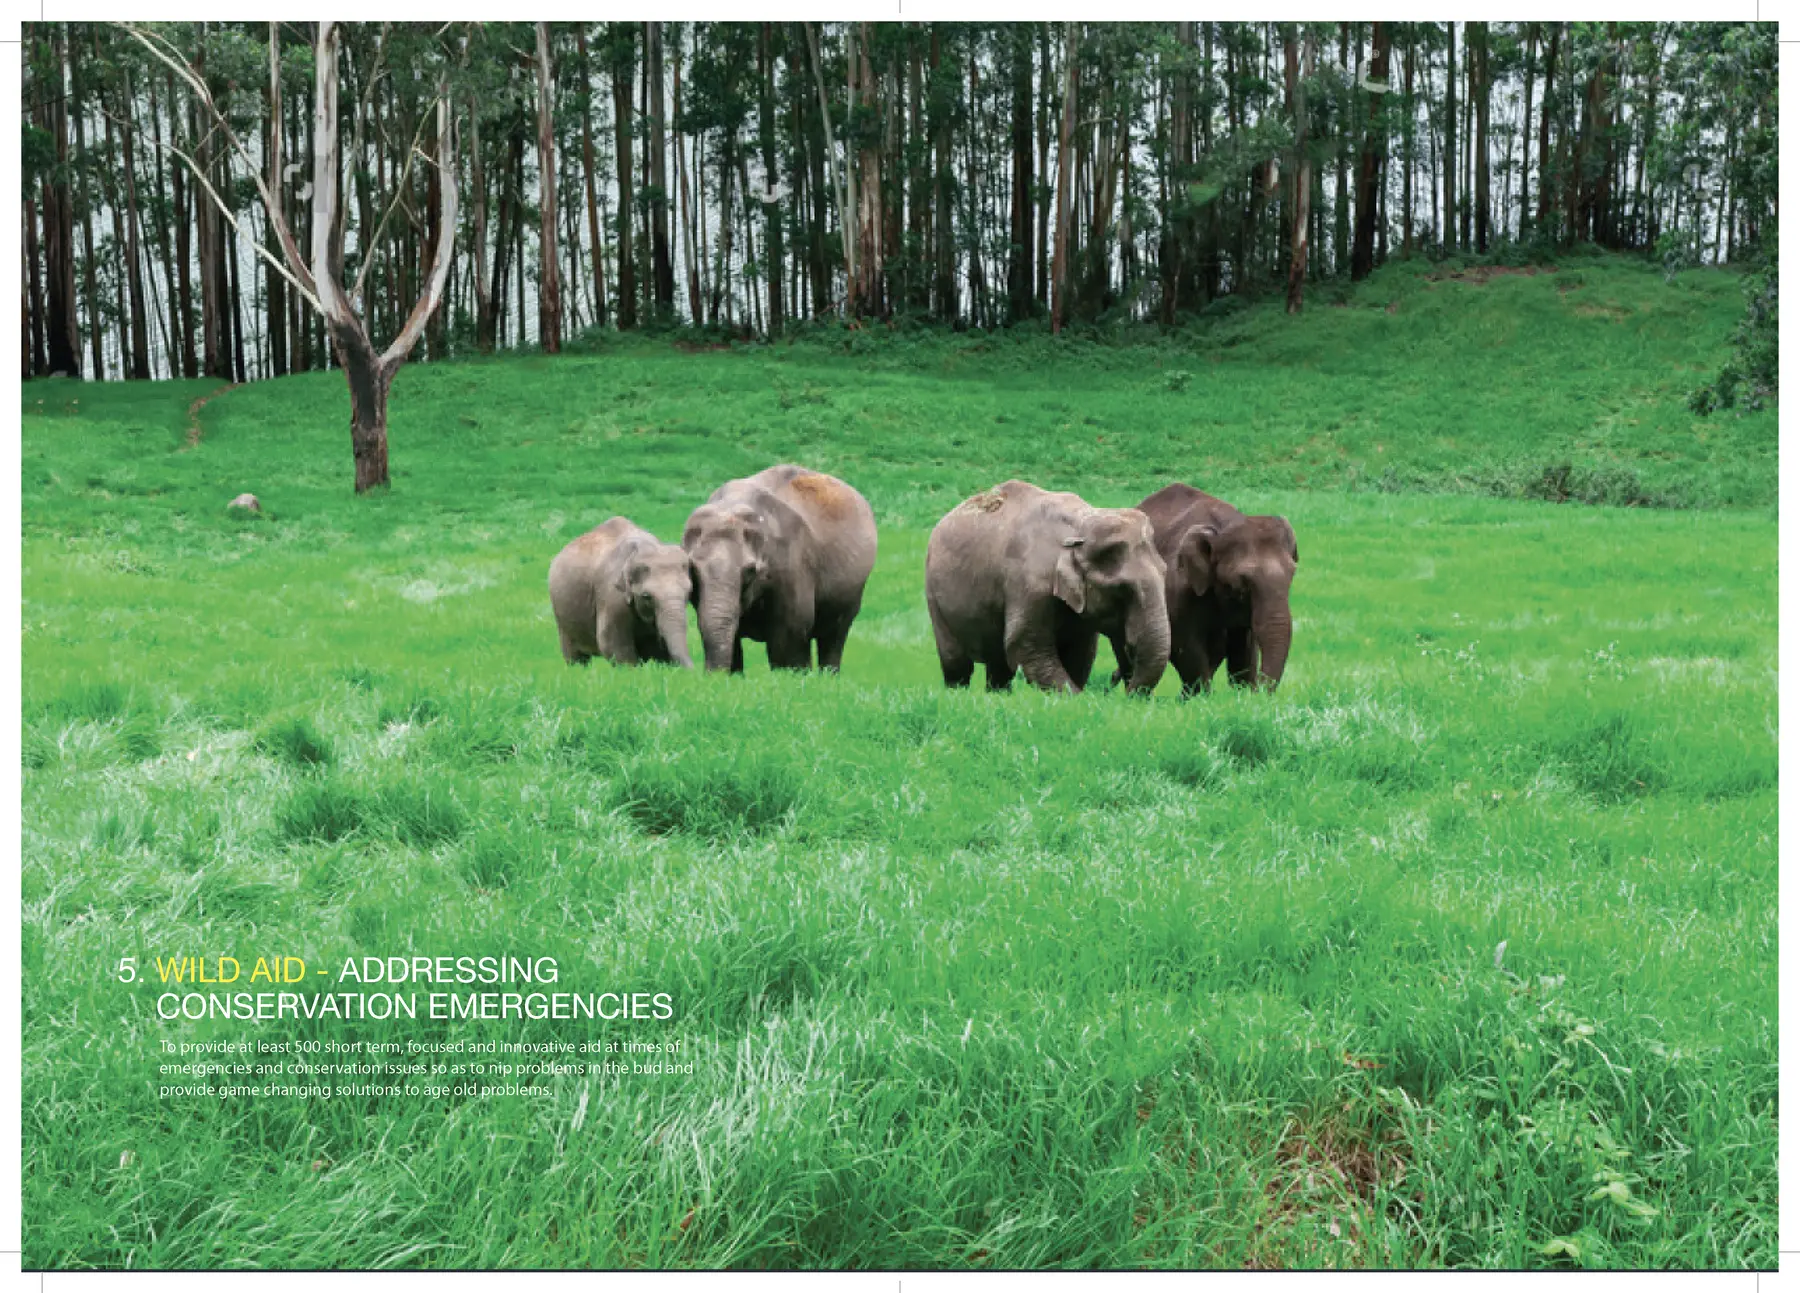
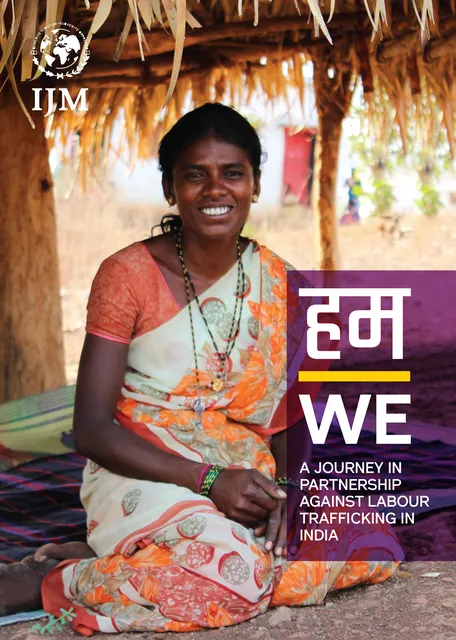
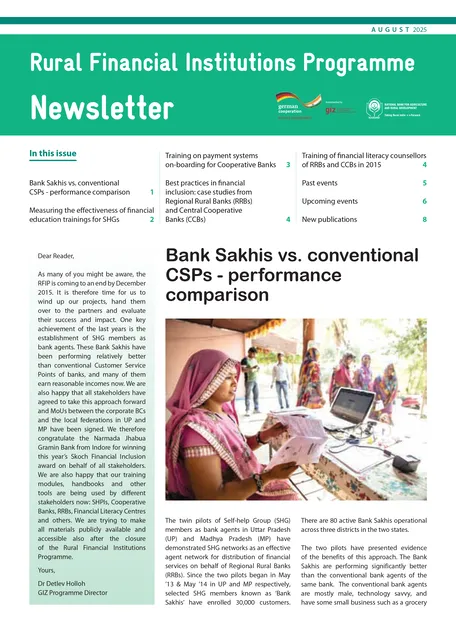
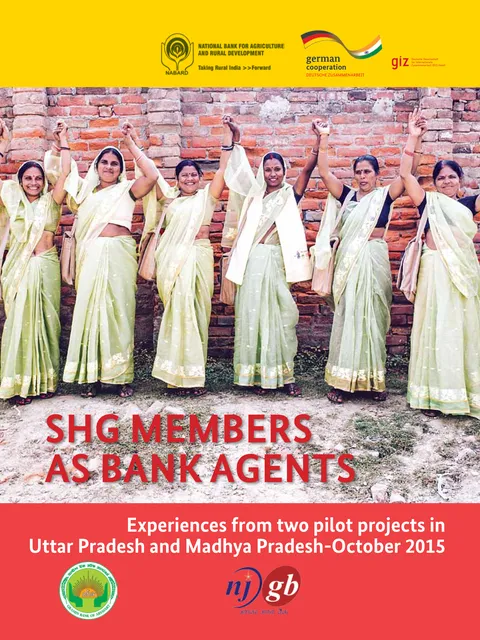
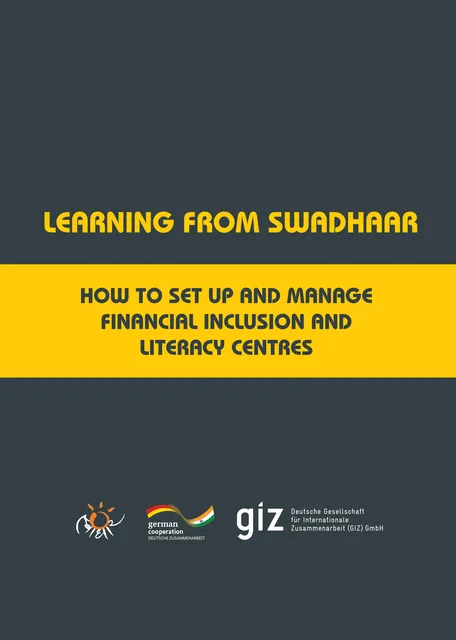
Clients and mastheads in portfolio include Fortune India, NABARD, GIZ, WTI and BBC research communication (from live site archive)
Print-ready artwork and optimized digital PDF delivered from one design system
Controlled revision cycles built for finance, leadership and stakeholder review
Direct studio contact: +91 99584 87751 / info@indakdigital.com
Sustainability Report Design Agency: What the Engagement Includes
Every engagement under our sustainability report design agency scope is delivered as a complete system rather than a set of pages:
01
Editorial structure and page architecture planned before design begins
02
Cover direction, grid, typography and chart language locked as one system
03
Data, tables and infographics designed to the source figures, not decorated around them
04
Controlled review rounds with named sign-off owners on your side
05
Press-ready artwork, optimized digital PDF and reusable working files
06
Pre-press checks and production coordination handled by the studio
Why Organizations Choose Us for Sustainability Report Design India
Three reasons come up in every reference call about our sustainability report design India work. First, the strategy is done before the styling: structure, hierarchy and reader-path decisions precede any visual direction. Second, the portfolio is verifiable - the archive on this site shows the actual documents, not mood boards. Third, production is part of the service: the studio that designed the file supervises the file, through pre-press and onto the press where required.
From the Studio Floor
A sustainability report earns trust through specificity, and layout either surfaces specificity or buries it. We design emission trajectories with baselines and target lines on the same axis, map initiatives to SDGs at the target level rather than the goal-logo level, and pair every photograph of impact with the metric it represents. When a claim has no number, the layout makes that visible too - which disciplines the content long before the reader ever sees it.
Alongside this service, teams frequently brief us on quarterly report design, analytical report design and ESG microsite design India within the same engagement, since one visual system serving several documents is cheaper and more consistent than three vendors producing three accents.
Budget Guidance
Report budgets move on five factors: page count, data density, content readiness, the number of review rounds, and print specification. We scope each explicitly and quote fixed, in writing, before work begins - and we itemize combined design-and-printing quotations so evaluation stays transparent. A free scope review of your current document is the fastest route to a reliable number.
Credentials and Standards
Indak Digital operates from Delhi (F 70 C, GTB Enclave) and serves organizations across India. Where the work touches disclosure or public communication, we design to the published expectations of bodies such as United Nations Sustainable Development Goals and Global Reporting Initiative (GRI), and we cite framework sources rather than paraphrase them. Our working standards extend across environmental performance visualization, SDG mapping design and climate disclosure layout - that standard extends to every file that leaves the studio. Portfolio references - including Fortune India editorial features, NABARD and GIZ program reporting and BBC research communication - are visible in the site archive and can be discussed on a call.
Frequently Asked Questions
What is the difference between a sustainability report and an ESG report?
In practice, sustainability reports lean narrative and stakeholder-facing while ESG reports lean framework and investor-facing - but the disclosure content overlaps heavily. We design both, and the right format depends on your primary reader and reporting obligations.
Can you map our initiatives to the SDGs visually?
Yes. SDG mapping is designed at the target level, showing which specific SDG targets each initiative advances and with what metric - a far more credible treatment than a row of goal logos.
Do you design climate and emissions data sections?
Yes. Emissions data is designed with baselines, target pathways and actuals on comparable axes, with methodology notes placed where readers can find them. Honest chart construction is non-negotiable in climate sections.
Start the Conversation
Send a brief to info@indakdigital.com or call +91 99584 87751 to see relevant case work and receive a scoped, fixed quotation for your project.