
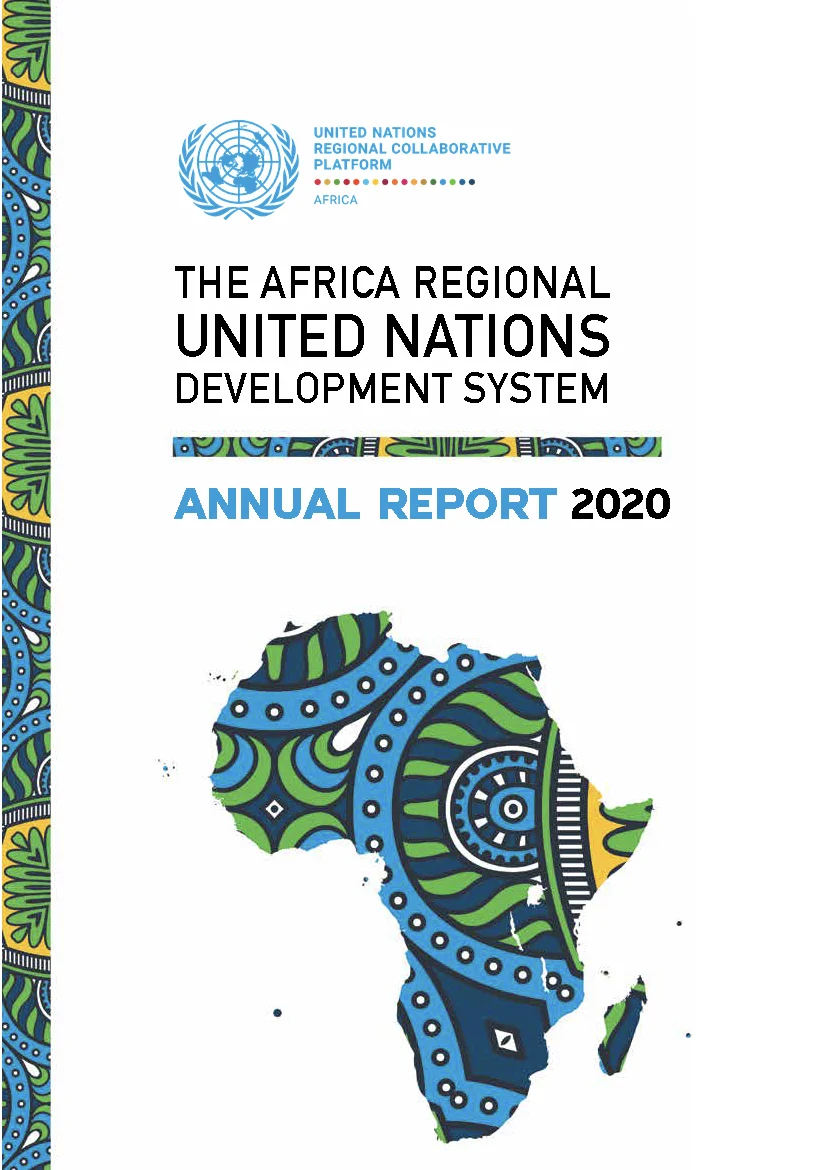
Digital Annual Report Design Beyond the Uploaded PDF
Digital annual report design is where most companies' ambition quietly ends at 'upload the print PDF'. The searchers who type this phrase want more: a report microsite investors can navigate, an interactive edition that makes charts explorable, a flipbook that at minimum respects the screen it lives on. Indak Digital designs digital report editions from the same system as print - one chart language, one structure - so the online experience extends the report instead of contradicting it.

The Short Version
Delhi-based design studio; portfolio spans 120+ page report systems (stat from indakdigital.com homepage)
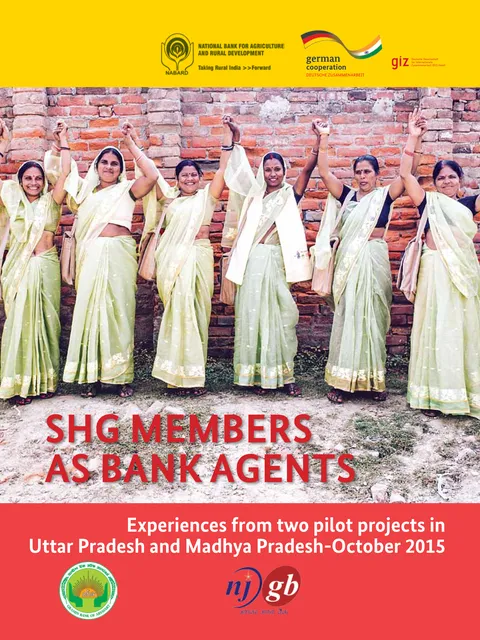
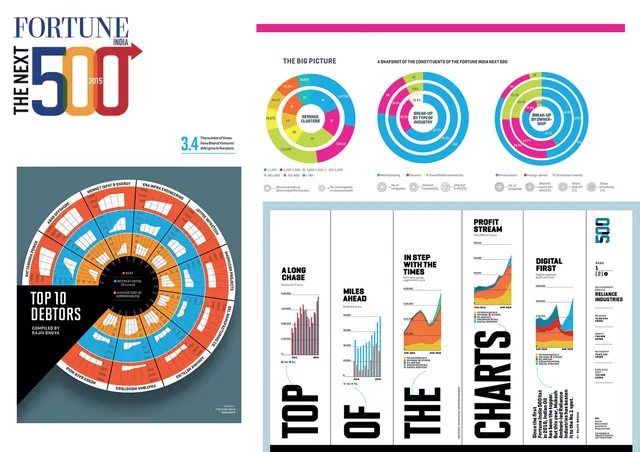
Clients and mastheads in portfolio include Fortune India, NABARD, GIZ, WTI and BBC research communication (from live site archive)
Print-ready artwork and optimized digital PDF delivered from one design system
Controlled revision cycles built for finance, leadership and stakeholder review
Direct studio contact: +91 99584 87751 / info@indakdigital.com
Interactive Annual Report Design India: What the Engagement Includes
Every engagement under our interactive annual report design India scope is delivered as a complete system rather than a set of pages:
01
Editorial structure and page architecture planned before design begins
02
Cover direction, grid, typography and chart language locked as one system
03
Data, tables and infographics designed to the source figures, not decorated around them
04
Controlled review rounds with named sign-off owners on your side
05
Press-ready artwork, optimized digital PDF and reusable working files
06
Pre-press checks and production coordination handled by the studio

How to Evaluate Annual Report Microsite Design India
When comparing providers for annual report microsite design India, ask to see complete documents rather than covers; ask who personally owns your revision cycle; ask how late data changes are absorbed without redesign; and ask whether pre-press checks are done in-house. Providers confident on all four will answer specifically. We publish our process on this page for exactly that comparison.
From the Studio Floor
A digital report's real design constraints are attention and accessibility. Web readers enter through search and skip - so a microsite gets a navigable disclosure architecture, anchor-level linking analysts can cite, and highlights that load before patience runs out. Accessibility is engineered, not claimed: heading structure, chart alt-descriptions, contrast and keyboard navigation to WCAG expectations, because a listed company's disclosures increasingly must be readable by everyone, including screen readers.
Alongside this service, teams frequently brief us on annual report flipbook service India, half yearly report design and analytical report design within the same engagement, since one visual system serving several documents is cheaper and more consistent than three vendors producing three accents.
Budget Guidance
Report budgets move on five factors: page count, data density, content readiness, the number of review rounds, and print specification. We scope each explicitly and quote fixed, in writing, before work begins - and we itemize combined design-and-printing quotations so evaluation stays transparent. A free scope review of your current document is the fastest route to a reliable number.
Credentials and Standards
Indak Digital operates from Delhi (F 70 C, GTB Enclave) and serves organizations across India. Where the work touches disclosure or public communication, we design to the published expectations of bodies such as Web Content Accessibility Guidelines (W3C) and Securities and Exchange Board of India (SEBI), and we cite framework sources rather than paraphrase them. Our working standards extend across web accessible reporting, navigable pdf architecture and online report experience - that standard extends to every file that leaves the studio. Portfolio references - including Fortune India editorial features, NABARD and GIZ program reporting and BBC research communication - are visible in the site archive and can be discussed on a call.
Frequently Asked Questions
What formats can a digital annual report take?
Three tiers: a properly navigable, bookmarked and accessible PDF; a flipbook edition for quick distribution; and a full report microsite with anchor-linked sections and interactive charts. Many companies run the PDF plus one richer tier.
Is the digital report consistent with the print edition?
Yes, by design: both editions come from one system - same structure, chart language and figures - so a number quoted from the microsite matches the filed print report exactly.
Do you build the microsite or only design it?
Both models are available: full design-and-build of the report microsite, or a complete design system handed to your development team with specifications. [CLIENT: confirm preferred delivery model to state on the page]
Start the Conversation
Share your document type, timeline and current content at info@indakdigital.com or call +91 99584 87751. We will show relevant portfolio work and return a fixed written quotation.